Stock and Investment Portfolio Tracker in Excel: Gain/Loss, Dividends, Concentration and Goal
- XLSX
- 14 KB
- Version 1.0
- English
- October 23, 2026
Ready to download
Editable Excel file
This sheet is also available in: العربية
Anyone investing in several shares and funds needs one clear picture: how big is my portfolio? how much have I made or lost? which holding is the biggest part? how much dividend have I received? Brokerage apps show some of that, but they do not combine several brokers and markets, nor give you control over how it is calculated.
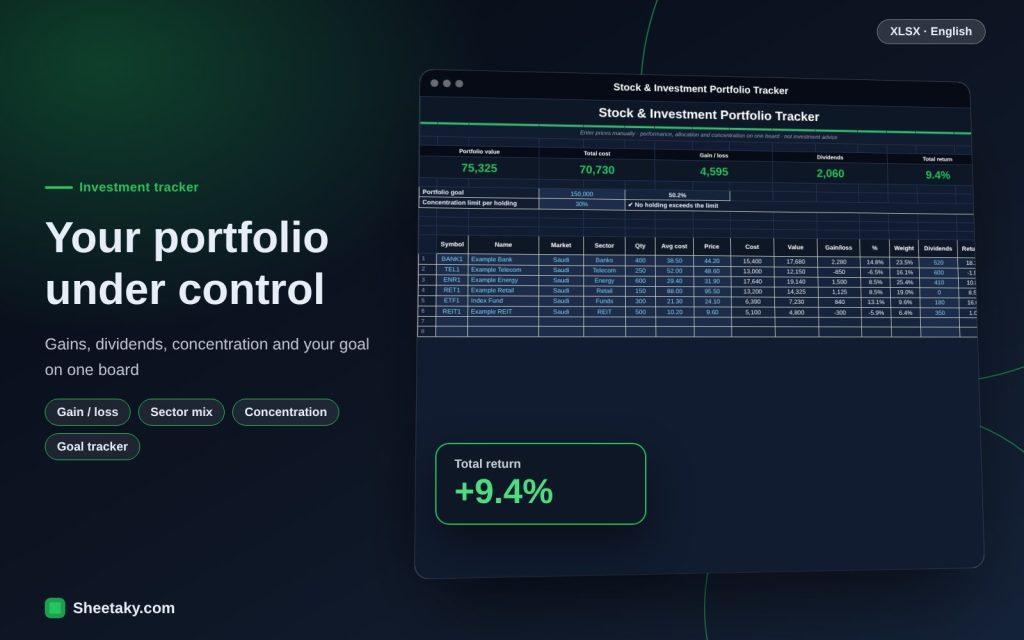
This sheet is a tracking board that runs on your computer. You enter each holding with symbol, market, sector, quantity, average cost, current price and dividends received, and it computes cost, value, gain and loss, each holding’s weight and total return, warns you if a holding exceeds the concentration limit, and shows sector allocation and how close you are to your goal.
Who is it for?
- Individual investors in stock and fund markets
- People with accounts at more than one broker
- People tracking dividends as income
- Students learning portfolio management
What is inside the sheet?
- A table of up to 15 holdings: symbol, name, market, sector, quantity, cost, price
- Calculations: cost, value, gain/loss, percent, weight and return with dividends
- Cards: portfolio value, cost, gain, dividends, total return
- A portfolio goal with a progress bar
- A concentration limit with an automatic alert
- A sector table and doughnut chart
- A guide sheet
How to use it
- Enter each holding: symbol, name, market, sector, quantity and average cost.
- Update the current price from your broker app or financial site whenever you like.
- Record dividends received for each holding.
- Enter your portfolio goal and the concentration limit you accept per holding.
- Watch the colours: green for gain, red for loss and orange for excess concentration.
Formulas used
Cost = quantity × average costValue = quantity × current priceGain/loss = value − costWeight = holding value ÷ portfolio valueTotal return = (gain + dividends) ÷ cost
Worked example from the sheet itself
A sample portfolio of six positions.
- Cost 70,730 and value 75,325 give a gain of 4,595.
- Dividends received of 2,060 give a total return of 9.4%.
- With a portfolio goal of 150,000 progress is 50.2%, and the biggest single weight is 25.4%, under the 30% concentration limit.
Why track your portfolio yourself
Tracking is not a luxury: numbers reveal what impressions hide. You may feel like a winner because one stock rose while it only covers the losses of three others. You may think you are diversified while 60% of the portfolio sits in one sector. Regular recording turns investing from a feeling into a decision.
Tracking dividends also changes your view: many investors judge performance by share price alone and neglect the cash that reaches them, though it is part of the return.
Average cost and unrealised gain
Average cost is the total you paid for a stock (including commissions) divided by the number of shares. If you bought 100 shares at 10 then 100 at 12, your average is 11. The gain in the sheet is “unrealised”: you only receive it when you sell, and it changes every day.
Include commissions and fees in cost so the return is honest, and remember that some markets tax capital gains or dividends differently from country to country.
Concentration and diversification
Excess concentration in one stock exposes you to the risk of a single company. We added a “concentration limit” (30%, say), so the weight turns orange when a holding exceeds it. There is no number right for everyone: it depends on experience, goals and ability to bear loss. Some investors cap each stock at 5–10 percent and some accept more in broad index funds.
The sector table reveals another concentration: you may hold five different stocks that are all banks. True diversification means holdings move for different reasons.
Goal and discipline
Set a number and a time: for example 150,000 in five years. The bar shows how far you have got. Then set the monthly saving you add, since in the early years success depends more on what you save than on returns.
Part of discipline is not changing your plan because of market noise, and reviewing the portfolio periodically (monthly or quarterly) rather than daily.
Limits of the sheet and important cautions
- Prices are entered by hand with no live market link.
- It does not handle splits or restructurings; edit quantity and cost by hand when they happen.
- It does not convert currencies; use one copy per currency.
- The sheet is a tracking tool, not a recommendation to buy or sell and not investment advice.
- Investing carries risk and can lose capital.
Tips for best results
- Update prices at a fixed time each week.
- Keep a copy each month for comparison.
- Note the last update date in a side cell.
Frequently asked questions
Does it fetch prices automatically?
No, they are entered by hand. This keeps your data private on your computer.
Does it suit funds and crypto?
It can be used for any asset with a quantity, a cost and a price.
What is the maximum number of holdings?
15 holdings in this version.
Is it investment advice?
No. It is a recording and calculation tool.
Download the sheet
Press the download button at the top of the page to get the Excel file. It includes a full guide sheet, yellow input cells and formulas protected from accidental edits. The sheet is also available in Arabic from the language switcher.
The sheet is a tracking tool and not investment advice.
Related sheets
Smart dashboards
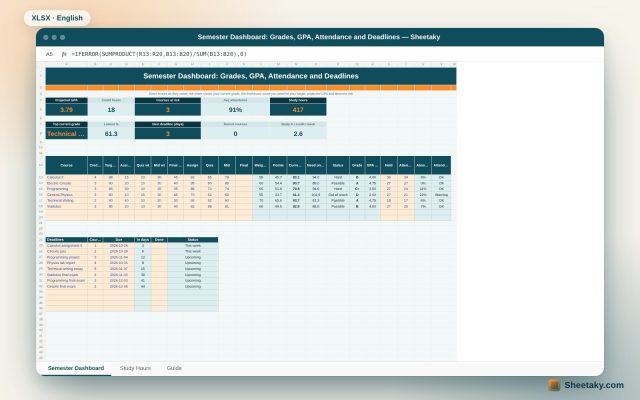
Student Semester Dashboard in Excel: Grades, GPA, Attendance and the Score Needed on the Final
An Excel board for university students: enter assignment, quiz and midterm scores to see your current grade in…
Smart dashboards
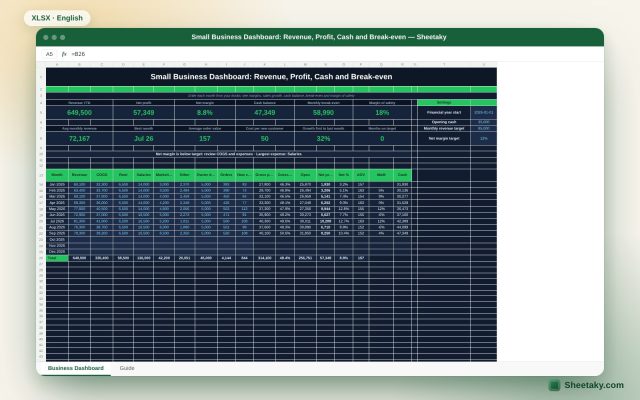
Small Business Dashboard in Excel: Revenue, Profit, Cash and Break-even
A monthly Excel board for a small business: enter revenue, costs and owner draws to calculate profit, margins,…
Smart dashboards
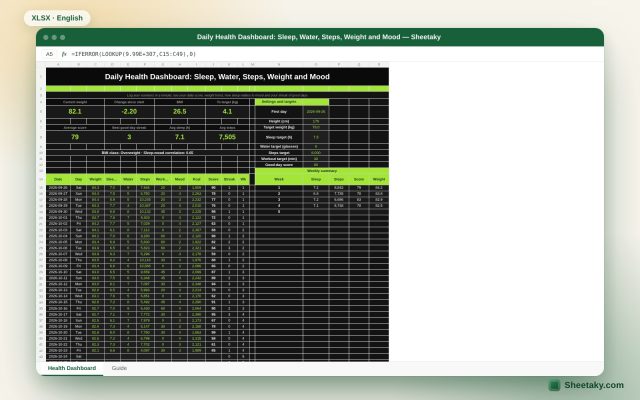
Daily Health Dashboard in Excel: Sleep, Water, Steps, Weight and Mood in One Score
An Excel board to track your daily health: log weight, sleep, water, steps, workout and mood to get…