Small Business Dashboard in Excel: Revenue, Profit, Cash and Break-even
- XLSX
- 16 KB
- Version 1.0
- English
- October 23, 2026
Ready to download
Editable Excel file
This sheet is also available in: العربية
Many small business owners know the bank balance but not whether they are really profitable. So they draw money without calculation and learn too late that the margin is thin or that rent and salaries are more than sales can cover.
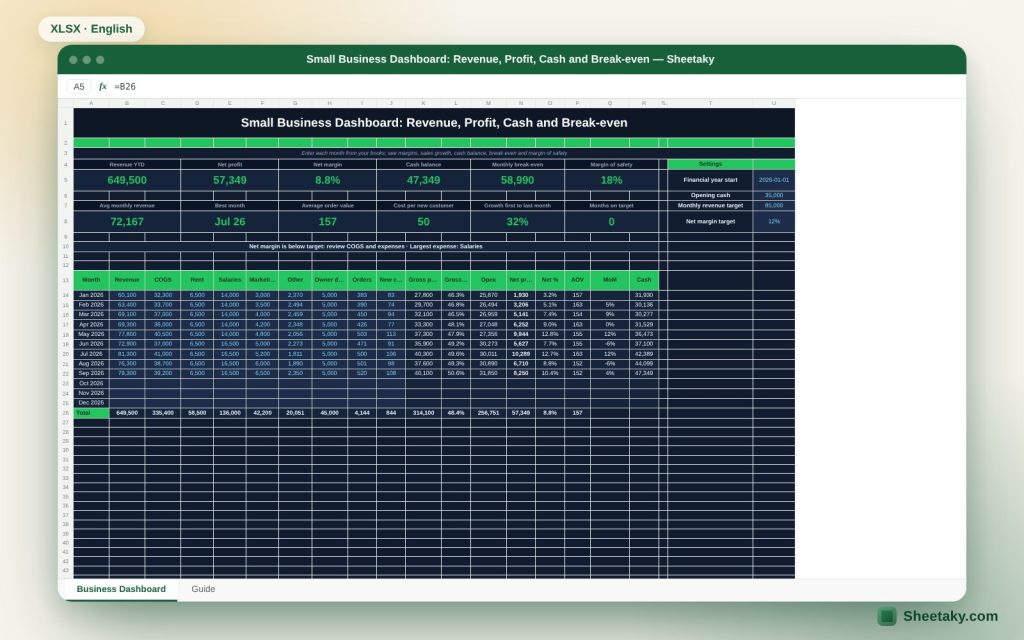
This board reduces the month books to a few figures: revenue, cost of goods, rent, salaries, marketing and owner draws, then calculates gross and net profit, margins, revenue growth, order value and expected cash balance, and gives you the number that matters most: the monthly revenue that covers your costs.
Who is it for?
- Owners of shops, restaurants, workshops and small offices
- Freelancers managing uneven income
- Startup founders before funding
- Accountants giving the owner a summary
What is inside the sheet?
- Thirteen input columns for twelve months
- Gross and net profit and the margin of each by month
- Average order value and monthly revenue growth
- A cumulative cash balance after draws
- Monthly break-even and margin of safety
- Cost per new customer and the best month
- Two charts for revenue and profit and for cash balance
How to use it
- Enter the financial year start, opening cash and targets.
- Enter each month figures from your books.
- Review margins and break-even.
- Compare net margin with your target and adjust costs.
Formulas used
Gross profit = revenue − cost of goodsNet = gross profit − (rent + salaries + marketing + other)Break-even = average opex ÷ gross marginMargin of safety = 1 − break-even ÷ average revenueCash = opening + cumulative (net − draws)
Worked example from the sheet itself
Nine months revenue is 649,500 and net profit is 57,349, a margin of 8.8%.
- Cash is 47,349 after draws of 45,000.
- Monthly break-even is 58,990 with a margin of safety of 18%.
- Average order is 157, a new customer costs 50 and revenue grew 32% from the first month to the last.
- The margin is below the 12% target and the largest expense is salaries.
Profit is not cash
You can profit on paper with no cash, and have money in the account while losing. The board separates net profit from the cash balance, which your draws affect, so you see how withdrawals threaten continuity.
Break-even
It is the revenue with neither profit nor loss, calculated from your average fixed costs and gross margin. If your average revenue is well above it you are safe, and the margin of safety measures that distance as a percentage.
Gross and net margin
Gross margin shows the health of your pricing and cost of goods; net margin shows the health of your management. If gross falls, review pricing and suppliers; if net falls while gross holds, review expenses.
Customer acquisition cost
Dividing marketing spend by new customers shows what winning a customer costs. Compare it with the profit a customer leaves to see whether marketing spend pays.
Tips for best results
- Close the month books in the first week of the next.
- Pay yourself a fixed salary instead of random draws.
- Keep a cash reserve covering two months of expenses.
- Compare each month with the same month last year.
Frequently asked questions
Does it work for any business?
Yes, put your cost of sales in the cost of goods column.
Does it calculate tax?
No, enter revenue net of VAT.
How do I handle yearly expenses?
Spread them over twelve months.
Download the sheet
Press the download button at the top of the page to get the Excel file. It includes a full guide sheet, yellow input cells and formulas protected from accidental edits. The sheet is also available in Arabic from the language switcher.
Management estimates, not accounting or tax advice; figures are illustrative.
Related sheets
Smart dashboards
Student Semester Dashboard in Excel: Grades, GPA, Attendance and the Score Needed on the Final
An Excel board for university students: enter assignment, quiz and midterm scores to see your current grade in…
Smart dashboards
Daily Health Dashboard in Excel: Sleep, Water, Steps, Weight and Mood in One Score
An Excel board to track your daily health: log weight, sleep, water, steps, workout and mood to get…
Smart dashboards
Wedding and Honeymoon Plan Dashboard in Excel: Budget, Guests, Payments and Deadlines
An Excel board to plan a wedding and honeymoon: a budget with estimates, contract prices and payments, a…