Small Business Feasibility and Break-Even in Excel: Startup Costs, Profit and 12-Month Payback
- XLSX
- 12 KB
- Version 1.0
- English
- October 23, 2026
Ready to download
Editable Excel file
This sheet is also available in: العربية
Before you spend the first riyal on a new business you should know: how much must I sell monthly to break even? how much profit will remain? when do I get back what I spent on setup? Many small businesses fail not because the idea is bad but because the owner did not run the numbers first, or ran them on an ideal month that will not happen at the start.
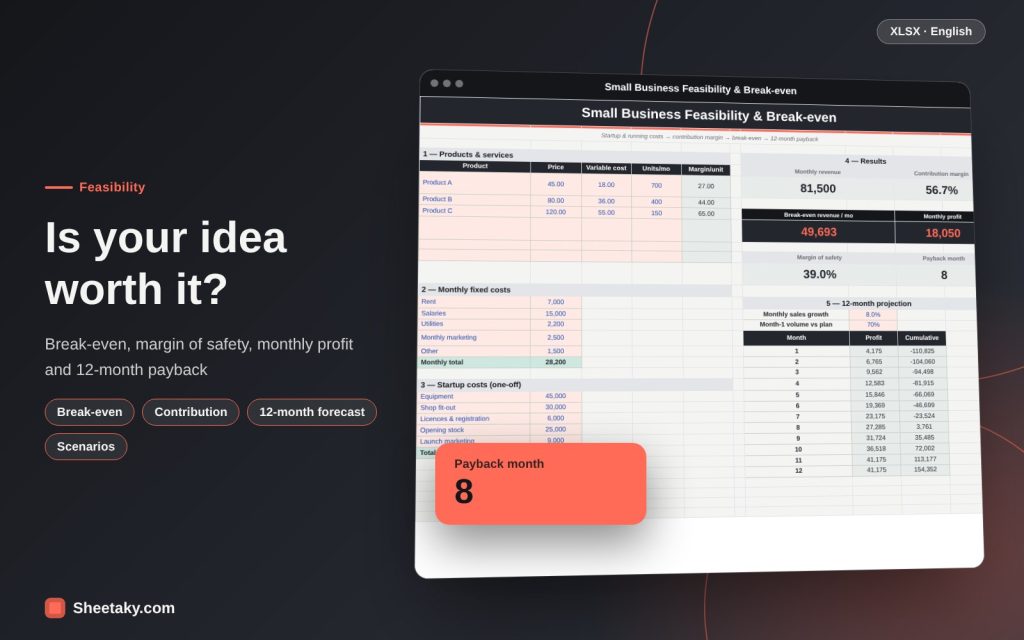
This sheet is a simple and honest feasibility study. You enter products with selling price, variable cost and expected quantity, then monthly fixed costs and startup costs, and it gives a board of revenue, contribution margin, break-even revenue, monthly profit and margin of safety, then projects 12 months with a sales growth rate you set and finds the month the business recovers its capital.
Who is it for?
- Anyone thinking of opening a shop, restaurant, online store or workshop
- Small business owners wanting to find the right selling price
- Entrepreneurship students and anyone preparing a business plan for a lender
- Consultants preparing first-cut feasibility studies
What is inside the sheet?
- A table of up to 6 products: price, variable cost, quantity and unit margin
- Monthly fixed costs and startup costs
- Cards: monthly revenue, contribution margin, break-even revenue, profit, margin of safety, payback month
- A 12-month projection with monthly growth and month-1 volume
- Profit and loss colouring and a line chart of cumulative cash
- A guide sheet
How to use it
- Enter your products: selling price, variable cost per unit and expected monthly quantity.
- Enter monthly fixed costs: rent, salaries, utilities and marketing.
- Enter one-off startup costs: equipment, fit-out, licences and stock.
- Read break-even revenue, monthly profit and margin of safety.
- Change the month-1 volume and monthly growth to try pessimistic, realistic and optimistic scenarios.
Formulas used
Unit margin = selling price − variable costContribution margin % = sum (unit margin × quantity) ÷ revenueBreak-even revenue = fixed costs ÷ contribution margin %Monthly profit = total contribution − fixed costsMargin of safety = (revenue − break-even revenue) ÷ revenueCumulative balance = sum of monthly profits − startup costs
Worked example from the sheet itself
An example: three products with monthly revenue of 81,500 and a contribution margin of 56.7%.
- Fixed costs of 28,200 give break-even revenue of 49,693, monthly profit of 18,050 and a margin of safety of 39%.
- Startup costs of 115,000, starting at 70% of sales and growing 8% a month, turn the cumulative balance positive in month 8.
What contribution margin is and why it is the base
Contribution margin is what remains of the selling price after the costs tied directly to each unit (materials, packaging, commission, delivery). That amount “contributes” to covering fixed costs and then profit. If you sell a product at 45 with a variable cost of 18, its margin is 27, and each unit sold adds 27 toward rent and salaries.
Separating fixed from variable costs is the most important step in feasibility. Fixed costs do not change with how much you sell in the month (rent, a core employee’s salary) and variable costs rise with sales. Mix them up and the break-even calculation collapses.
Break-even: how much must I sell?
The break-even point is the sales at which total margin equals fixed costs, with no profit and no loss. The formula is simple: break-even revenue = fixed costs ÷ contribution margin ratio. In our example 28,200 ÷ 0.567 ≈ 49,693 a month. If your expected sales are 81,500 you are 39% above break-even.
The margin of safety is that percentage: how far sales can fall before you lose money. A 10% margin of safety means a fragile business, and 30% or more means a reasonable ability to face a weak season.
Why start sales lower
New businesses do not sell at the expected level from day one: people do not know you yet, and marketing takes time. So we added “month-1 volume” (70%, say) and “monthly growth” (8%), so you see how many months you lose before settling.
Advice: make your first forecast conservative. It is better to be surprised by higher sales than shocked by lower. Also try a pessimistic scenario (50% and 3% growth) to see whether you can afford it.
Startup costs and opening liquidity
Payback in the sheet measures when what you spent on setup returns, but it does not replace a liquidity reserve. Any new business needs working capital to cover the first months in which it may lose money. Review the negative monthly figures in the table and add them up: that is the minimum liquidity you should have in hand on top of startup costs.
Do not forget items often forgotten: insurance, maintenance, bank fees, equipment depreciation and your own salary.
Using the results in your decision
- If break-even revenue is higher than your highest realistic sales, rethink pricing or costs.
- If contribution margin is low (below 30% in retail), look for a price rise or a lower unit cost.
- Compare the payback month with the lease term, and do not set up for longer than the lease.
- Show the numbers to someone experienced in your field before committing.
Tips for best results
- Use real supplier quotations rather than general estimates.
- Record your assumptions in a file beside the sheet.
- Update the numbers after the first three months of actual trading.
Frequently asked questions
Is the sheet suitable for services?
Yes, enter the service as a product with its variable cost (time, materials, commissions).
Does it compute tax and interest?
No, figures are before tax and interest. Add them to fixed costs if needed.
How many products?
Six products.
Is it an official feasibility study?
It is a first-cut study; formal financing needs a detailed report.
Download the sheet
Press the download button at the top of the page to get the Excel file. It includes a full guide sheet, yellow input cells and formulas protected from accidental edits. The sheet is also available in Arabic from the language switcher.
The sheet’s projections rest on your figures and are not a guarantee of results.
Related sheets
Smart dashboards
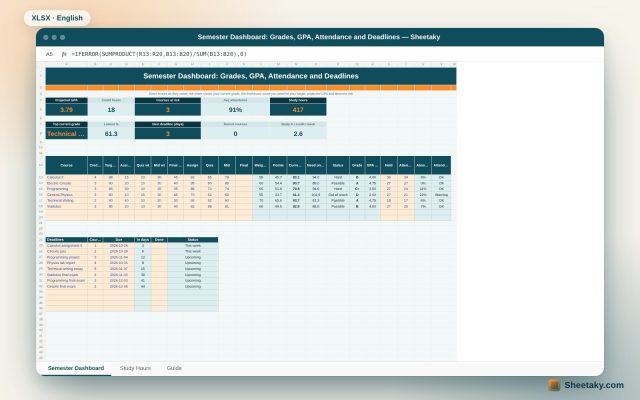
Student Semester Dashboard in Excel: Grades, GPA, Attendance and the Score Needed on the Final
An Excel board for university students: enter assignment, quiz and midterm scores to see your current grade in…
Smart dashboards
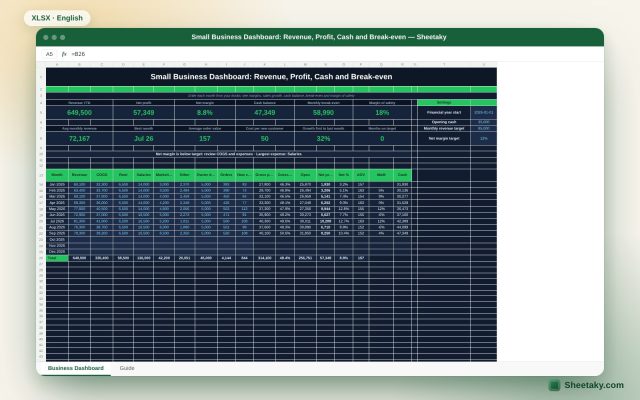
Small Business Dashboard in Excel: Revenue, Profit, Cash and Break-even
A monthly Excel board for a small business: enter revenue, costs and owner draws to calculate profit, margins,…
Smart dashboards
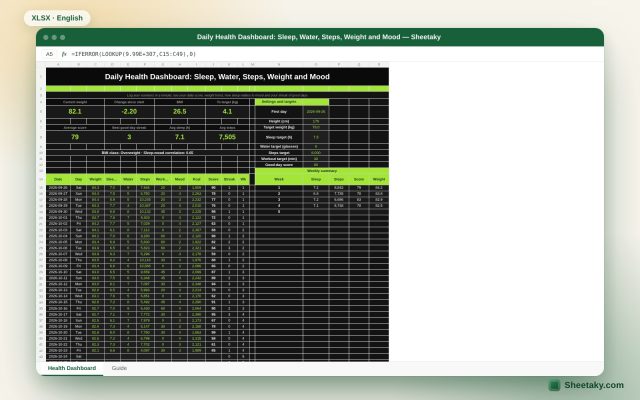
Daily Health Dashboard in Excel: Sleep, Water, Steps, Weight and Mood in One Score
An Excel board to track your daily health: log weight, sleep, water, steps, workout and mood to get…